merdan

merdan

Coinbase faces SEC probe over historical user metrics: report

Coinbase's stock fell 6% following news of a federal investigation by the SEC into whether the company overstated its user numbers, coinciding with a cybersecurity breach where hackers stole customer data and demanded a $20 million ransom. The investigation relates to a metric the company stopped reporting two and a half years ago, while the breach could cost Coinbase up to $400 million.

XRP Price Explosion To $5.9: Current Consolidation Won’t Stop XRP From Growing

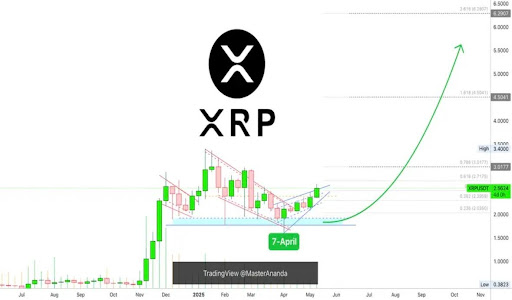
The XRP price is once again in the spotlight as a new technical analysis indicates that the cryptocurrency may be on the verge of a significant price explosion to $5.9 and beyond. According to the analyst behind this forecast, XRP’s recent price behavior is not a sign of weakness but rather a period of strategic consolidation that is building momentum for the next major surge.  Consolidation Phase To Fuel XRP Price Explosion  Master Ananda, a crypto analyst on TradingView, released a detailed analysis of XRP on May 15. The analysis highlights the cryptocurrency’s current price action and predicts its next bullish move. Starting with its historical price behavior, the analysis highlights a strong rally that took place in 2024, particularly around November and December, when XRP printed long green candles that indicated strong momentum. Related Reading: Analyst Says XRP Must Hold This Level For Bullish Continuation To $4.2 After reaching a high, XRP entered a consolidation phase, during which price action formed a pattern resembling a symmetrical triangle or wedge. This is marked with red dashed lines on the chart, showing indecision in the market as the price was suppressed.  Master Ananda revealed that after this triangle formation, XRP broke out around April  7, 2025 — a date now marked as a potential inflection point in the cryptocurrency’s market cycle. Since then, weekly candles have consistently closed in the green, indicating renewed bullish momentum.  Adding to Master Ananda’s bullish case for the XRP price is a Fibonacci retracement and extension levels drawn from the previous major swing high to the recent low. These levels help identify potential resistance and target zones for the next leg up.  Notably, the retracement levels have been marked around $2.05 (0.236 Fib), $2.39 (0.382 Fib), and $2.71 (0.618 Fib), culminating at the previous high of $3.40. Fibonacci extension project potential targets are at $4.50 (1.618 Fib), and the highest level is at $6.29 (2.618 Fib).  Currently, the trajectory of the curved green arrow in the chart shows a more probable price target of around $5.9. However, XRP will still have to surge past the aforementioned retracement levels and the resistance at $4.5 to reach this level. The overall takeaway of this analysis is that XRP is printing strong bullish signals, and its current consolidation is seen as a precursor to further growth.  The asset Approaches Make Or Break Zone XRP is entering a decisive phase, as crypto analyst Egrag Crypto predicts an imminent breakout from a tight consolidation range, within which the cryptocurrency has been trading for months. The analyst’s chart shows a purple zone, which he described as a “pandora box.” This zone represents a critical price range acting as both resistance and support, effectively trapping price action. Related Reading: XRP Price Surge To $10: Analyst Reveals Factors That Will Make It Happen In 2025 Egrag Crypto emphasizes that a breakout above or below this boxed range could ignite high volatility and significant momentum for XRP. He frames it as a pivotal moment where big moves, possibly explosive ones, are expected to happen. Featured image from Getty Images, chart from Tradingview.com

Ethereum Faces Resistance Against Bitcoin – ETH/BTC Bullish Structure In Question

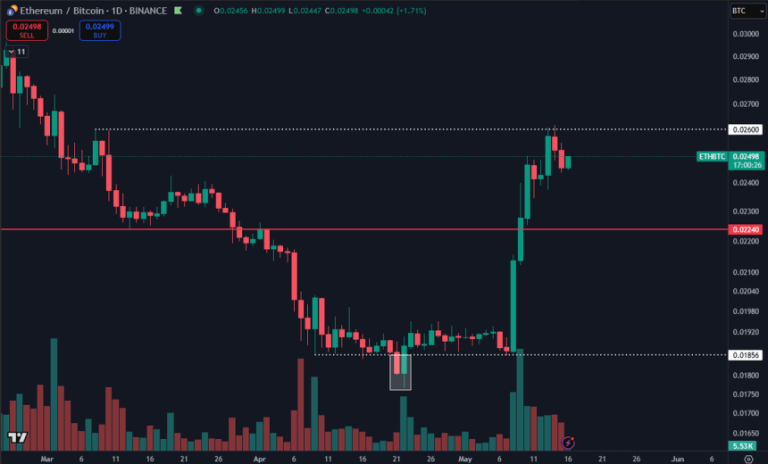
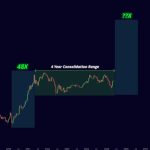
After a strong rally that pushed Ethereum to a local high of $2,730, the asset has retraced over 10%, now testing key support levels as the market cools off. The correction comes after days of heavy buying pressure and growing expectations of a broader altseason. However, the recent pullback has sparked debate among analysts and traders, with sentiment now split between those anticipating another leg up and others preparing for a deeper correction. Related Reading: Ethereum Multi-Year Consolidation Could Spark A Parabolic Move – Details Some believe this pause is healthy and necessary before Ethereum resumes its uptrend. Others argue that ETH could retest lower zones, especially if Bitcoin remains range-bound. Top analyst Daan weighed in by highlighting the ETH/BTC pair, pointing out that Ethereum, after its big move up, is now facing resistance around the 0.026 BTC level. With Ethereum still trading far below its all-time high and caught in a wide macro range, the coming days may prove decisive. Whether this is just a short-term cooldown or the start of a larger correction, Ethereum’s current levels will likely dictate the momentum heading into the next phase of the market. Ethereum Holds Critical Support As ETH/BTC Pair Faces Key Resistance Ethereum continues to show resilience despite recent volatility, maintaining its position above the $2,400 level. This zone now acts as crucial support, and bulls must defend it to preserve the broader bullish momentum. While price action has cooled slightly following its sharp run to $2,730, ETH remains one of the stronger performers in the market, holding up well amid increased uncertainty and speculative positioning. Much of the current optimism hinges on Ethereum’s performance relative to Bitcoin. If ETH continues to outperform BTC, analysts believe it could trigger the long-awaited altseason — a market phase where altcoins significantly outperform Bitcoin. Daan shared insights on this dynamic, focusing on the ETH/BTC ratio, which has gained notable strength in recent sessions. According to Daan, ETH has now run into resistance near the 0.026 level after a sharp rally. For bullish momentum to continue, ETH must hold above 0.0224. A break below this key support could trigger a slow bleed and potentially unwind the entire recent move. On the upside, a clear break above 0.026 would open the door to a move toward 0.03 and beyond. In short, Ethereum’s short-term direction will likely be shaped by its ability to hold $2,400 and maintain strength against Bitcoin. If both conditions are met, the case for a sustained altcoin rally grows significantly stronger. Related Reading: Dogecoin Whales Accumulate 1 Billion DOGE In A Month: Fueling Price Surge Speculation ETH Pulls Back Into Support After Failing To Break $2,700 Ethereum is currently trading at $2,485, following a sharp retracement from its recent local high near $2,730. The chart shows that ETH failed to hold above the 200-day simple moving average (SMA) at $2,701, which acted as a strong resistance zone. After days of sustained upward momentum, this rejection has pushed the price back toward the 200-day exponential moving average (EMA) around $2,438 — a key level that now serves as immediate support. Volume has remained elevated during this move, suggesting active participation from both bulls and bears. Despite the rejection from the 200 SMA, Ethereum is still holding well above its breakout zone from early May, where the price surged from under $2,000. If bulls can defend the EMA and keep price above $2,400, this could form a higher low and set the stage for another attempt at reclaiming the $2,700–$2,800 area. Related Reading: Solana Sees Renewed Demand As Capital Flows Turn Positive – Details However, if ETH loses the $2,400 level, momentum could shift in favor of the bears, potentially triggering a larger correction. For now, Ethereum remains in a consolidation phase within a broader bullish structure. The next few daily closes will be critical to confirm if the pullback is healthy or a signal of deeper weakness. Featured image from Dall-E, chart from TradingView

Bitcoin to outperform gold in second half of 2025: JP Morgan

Gold prices have recently declined after reaching record highs, while Bitcoin has gained traction, with JP Morgan analysts predicting Bitcoin will outperform gold for the remainder of the year due to increased institutional adoption and a shift in investor preferences. The trend indicates a significant movement of funds from gold to Bitcoin as more US states and companies invest in the cryptocurrency.

FTX Token surges 14% ahead of $5B creditor distribution

FTX Token (FTT) surged nearly 14% following the announcement that FTX will begin a $5 billion creditor distribution on May 30, 2025. This optimism around the company's recovery efforts has contributed to the token's price increase, which has risen significantly since hitting an all-time low in April.

Bitcoin Pepe gains steam as Eric Trump eyes cheap BTC to rival Saylor’s accumulation

Top US crypto investors, including Michael Saylor and Eric Trump, are intensifying their focus on Bitcoin, with Trump's American Bitcoin planning to explore low-cost mining to compete with Saylor's strategy. Meanwhile, the new meme ICO Bitcoin Pepe (BPEP) is gaining popularity, raising nearly $8.5 million ahead of its May 31 listing, offering a unique investment opportunity for retail investors in the Bitcoin ecosystem.

Top crypto to buy as Saudi Central Bank reveals exposure to MSTR

Bitcoin and other cryptocurrencies have surged recently following the Saudi Central Bank's disclosure of its investment in MicroStrategy, which holds a significant amount of Bitcoin. This institutional interest is seen as a positive sign for the crypto market, potentially boosting confidence in Bitcoin and related assets like meme coins.

Bitcoin Strengthens Vs. Gold, Analyst Sees ‘Higher Than Expected’ Returns

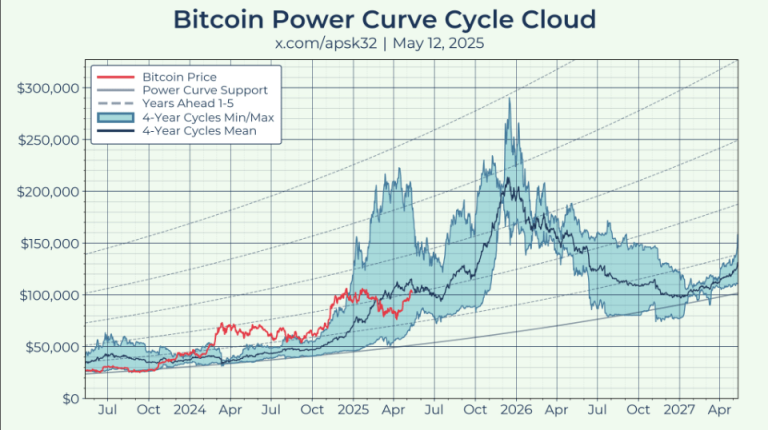
Bitcoin’s price may surge above $200,000 next year, according to recent analysis by X account Apsk32. He warns that the familiar four‑year cycle for BTC often lines up with fresh highs. Short swings have hit traders hard before. This time, bulls say Bitcoin could even top $250,000 in 2025. Related Reading: XRP Frenzy Builds: Over $1 Billion in Open Interest Signals Breakout Tension Bitcoin Gold Link According to Apsk32, Bitcoin often trails gold by a few months. Gold hit a record $3,500 per ounce earlier this year. If Bitcoin follows that path, it could surge. He measures Bitcoin’s market value in ounces of gold instead of dollars. That way, money printing and inflation don’t skew the view. Power Curve Model Apsk32 uses what he calls a “power curve” tool. It fits Bitcoin’s market cap in gold ounces to a smooth curve. The tool stretches back to the 2017 high near $20,000. When plotted, it suggests a 2025 bull‑market peak above $200,000. He told X followers that “if Bitcoin’s position relative to gold keeps improving, returns could top expectations.” Bitcoin’s position relative to gold has improved considerably since April. This is the indicator that gives me hope for higher than expected returns later this year. BTC-USD is close to extreme greed, which sounds scary, but it’s also where we would expect to be if Bitcoin… pic.twitter.com/CY1Qxy4Hdi — apsk32 (@apsk32) May 16, 2025 Realistic Price Targets While some models push for $444,000 this year—what Apsk32 credits to “five years ahead of support”—he thinks a more realistic goal is $220,000. He added there’s a “decent chance” BTC hits $250,000, but he doesn’t see that as the most likely outcome. The $220,000 level would still mark a 10× jump from Bitcoin’s low near $22,000 in late 2022. Gold Market Scenarios Other market experts ran a different test. They looked at how much Bitcoin could be worth if it claimed part of gold’s total value. If gold reaches, say, $5,000 per ounce by 2030 and Bitcoin grabs half of gold’s market cap, BTC could hit a price of more than $920k. But then, these figures are scenario‑based, not firm predictions. Supply And Demand Factors Bitcoin’s supply is capped at 21 million coins. Every block halving makes new BTC rarer. These events come roughly every four years. The next one is expected in 2024. After that, miner rewards fall from 6.25 BTC to 3.125 BTC per block. Scarcity has driven prices up in past cycles. But demand could shift if big investors pull back. Related Reading: Analysis: Crypto Heats Up As $35 Billion Enters Market In Under A Month Risks And Opportunities Volatility in both gold and Bitcoin could upend these models. Gold can face sudden drops when traders take profits. Bitcoin has swung 20% or more in a single day before. Regulatory moves, geo‑political events, and tech upgrades all play a part. Still, setting clear price scenarios helps investors plan. Featured image from Unsplash, chart from TradingView